The North Carolina Clean Energy Technology Center’s (NCCETC) Clean Transportation team is committed to developing materials that increase public awareness of the development and use of alternative fuels and advanced transportation technologies. Prior to transitioning to roles at NC State University’s Institute for Transportation Research and Education, former NCCETC Clean Transportation Senior Project Manager Alexander Yoshizumi and intern Hemil Mehta created educational infographics and an interactive map about the various electric vehicle (EV) charging stations that are available in North Carolina.
The infographics include a short history of the different charging systems, power ratings, plug-in locations within 50 miles of North Carolina, the top three counties by charger count, and the average new plugs per year over the past five years. Charts are used to indicate the plug’s power distribution as well as the plug density.
See the infographics that detail the Combined Charging System (CSS), CHArge de MOve (CHAdeMO), and North American Charging Standard (NACS) below:
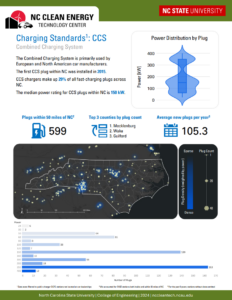
This infographic communicates that CCS is typically used by car manufacturers in Europe and North America. The chargers were first installed in North Carolina in 2015, and as of 2024 they make up 29% of all fast-charging plugs across the state, with a median power rating of 150kW. There are 599 CCS plugs within 50 miles of NC, with the most plugs located in Mecklenburg county. Over the past five years, the average number of new plugs per year is 105.3. A visualization of the location of plugs within 50 miles of the state is included, along with charts that indicate the power distribution and plug density of CSS stations.
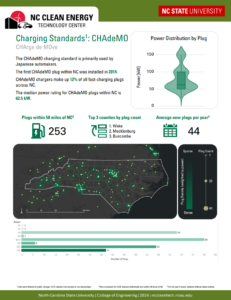
Used primarily by Japanese automakers, the first CHAdeMO plug in NC was installed in 2014. As of 2024, CHAdeMO chargers make up 12% of all fast-charging plugs across the state with a median power rating of 62.5kW. There are 253 plugs located within 50 miles of NC, with the largest number located in Wake county. Over the past five years, there has been an average of 44 new plugs installed each year. A visualization of the location of plugs within 50 miles of the state is included, along with charts that indicate the power distribution and plug density of CHAdeMO stations.
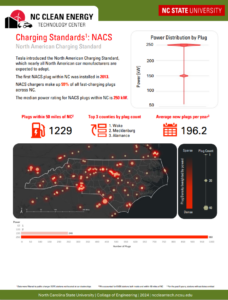
NACS charging stations were first introduced by Tesla, and the first plugs in NC were installed in 2013. NACS plugs are more common than CSS and CHAdeMO stations within the state and make up 59% of all fast-charging plugs across North Carolina, with 1,229 plugs located within 50 miles of the state. The plugs have a median power rating of 250kW and an average of 196.2 plugs have been installed per year, over the last five years. A visualization of the location of plugs within 50 miles of the state is included, along with charts that indicate the power distribution and plug density of NACS stations.
Yoshizumi noted that there are many chargers with very high-power ratings within the state, which puts North Carolina in a great position to advance EV use.
In addition to the infographics, Mehta compiled data about public charging infrastructure in North Carolina and created a visualization that can be used to find the location of charging stations and the average power of the stations measured in kilowatts.
These resources can be instrumental to those who own EVs or are looking to transition to zero tailpipe-emission vehicles. Quickly finding a compatible charging station is essential when driving long distances in an EV. Yoshizumi says, “This is directly supporting transportation resilience work within the state of North Carolina and helps to ensure that EVs are prepared for evacuation as severe weather is projected to increase in the future.”
Both the data included in the infographics and in the interactive map are current as of 2024. The infographics can also be found on the publications page of NCCETC’s website.


